.png)
Menu & Profitability
80/20 Recipe Costing: Find your menu's money without costing every dish


You had a busy month. Or at least it felt like one. Somehow there's still less in the bank than there should be. That gap usually has three suspects, and they're part of every credit card you swipe: what you actually pay to take that card, what you actually make on what's on the check, and how many of those guests actually come back.
Your POS already has this data. It just doesn't surface it in a way you can use. And seeing it doesn't take new software. It takes knowing which of the three to address, and where to look first.
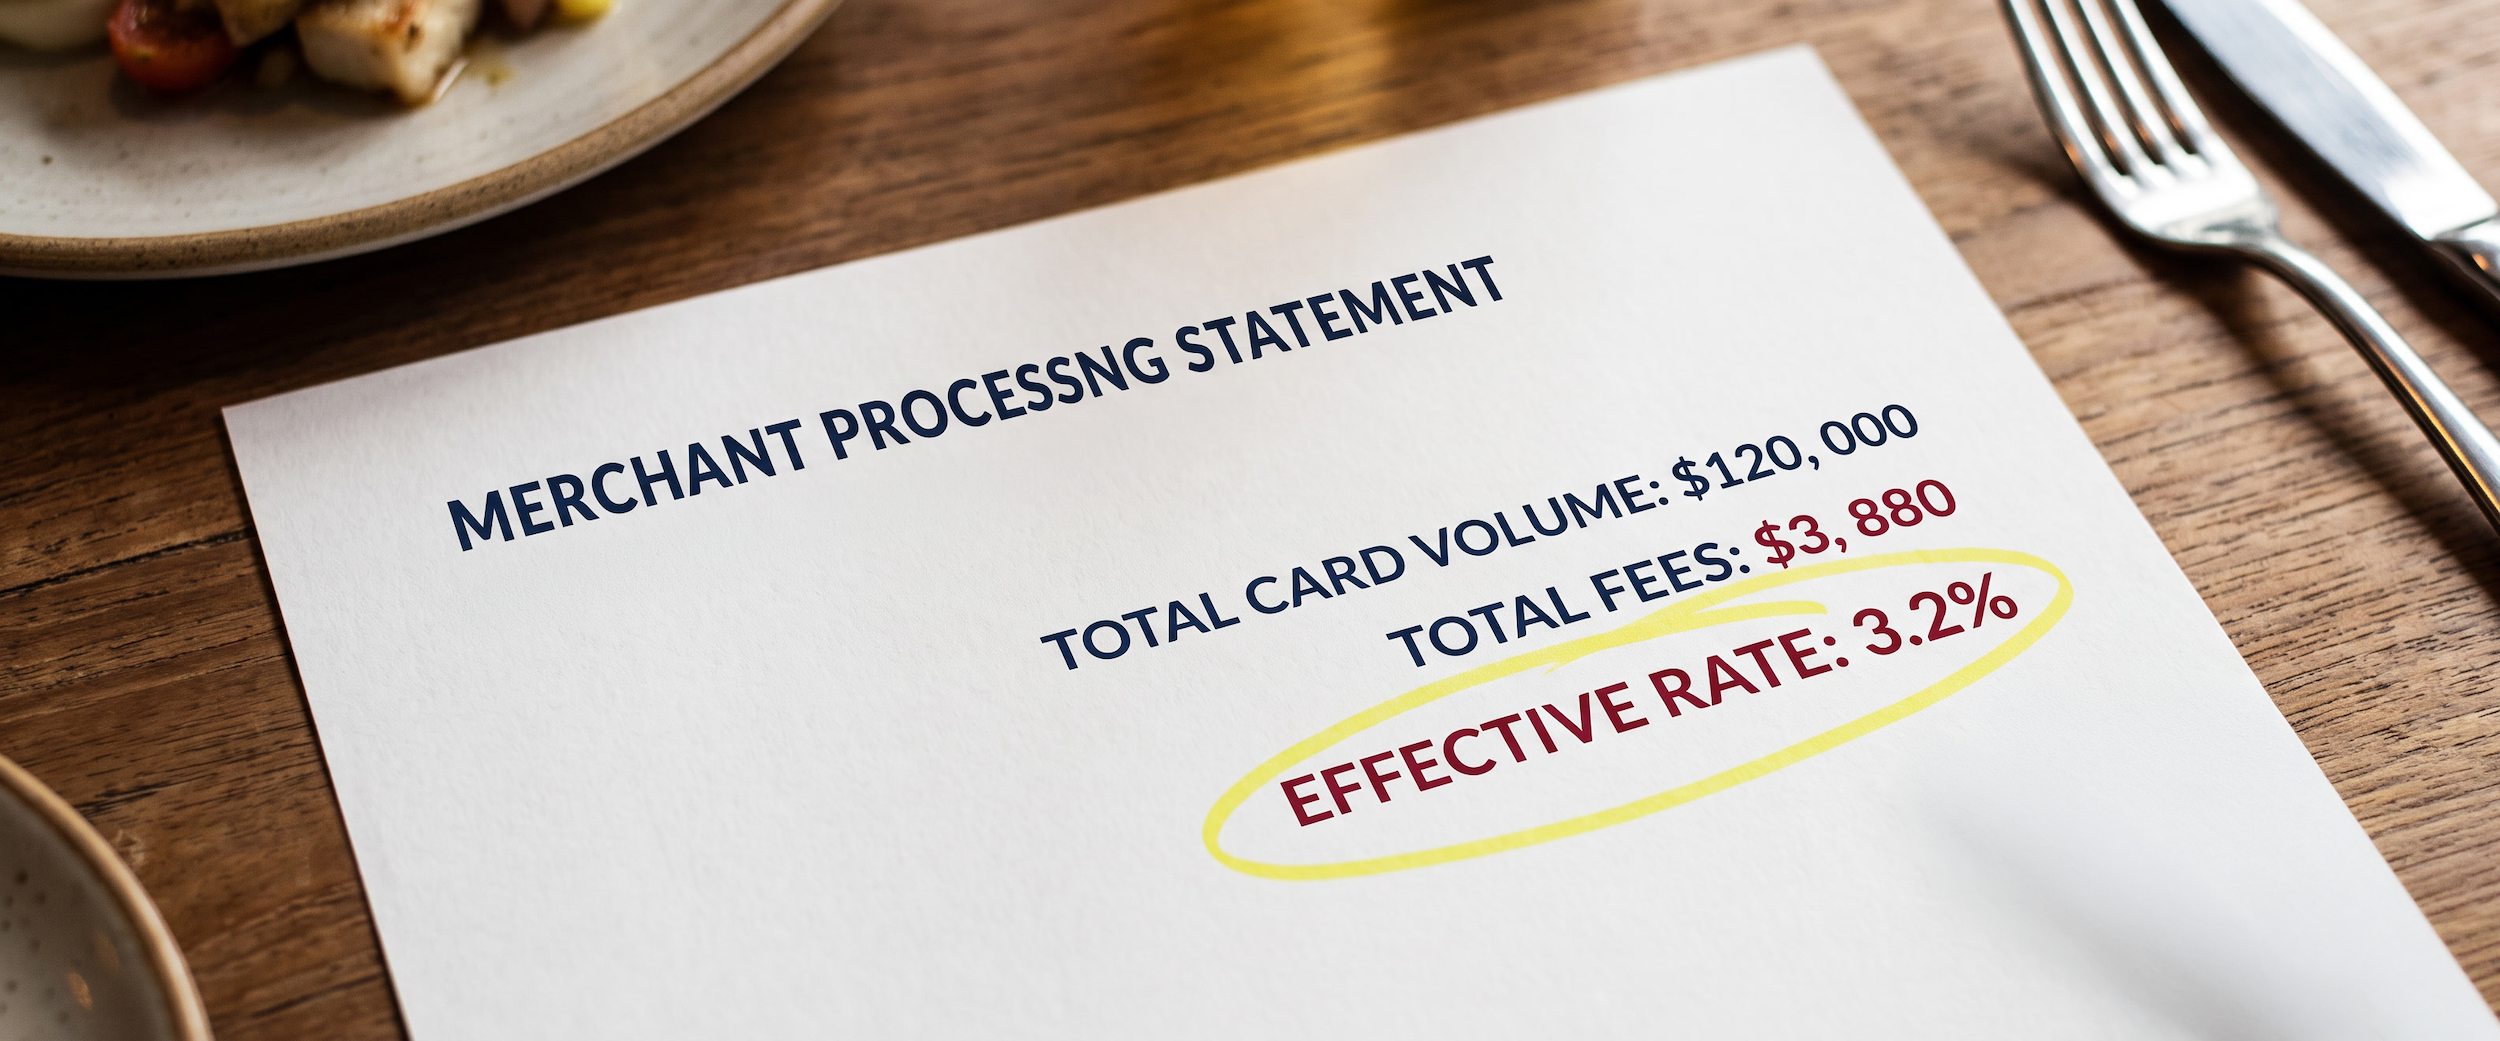
Your effective rate, what you actually pay to accept a card, is buried in a merchant statement full of tiers, line items, and fees most owners never read. The real question is simple: what did you pay in processing last month, and on what volume?
The math is simple:
Fees ÷ card volume = effective rate.
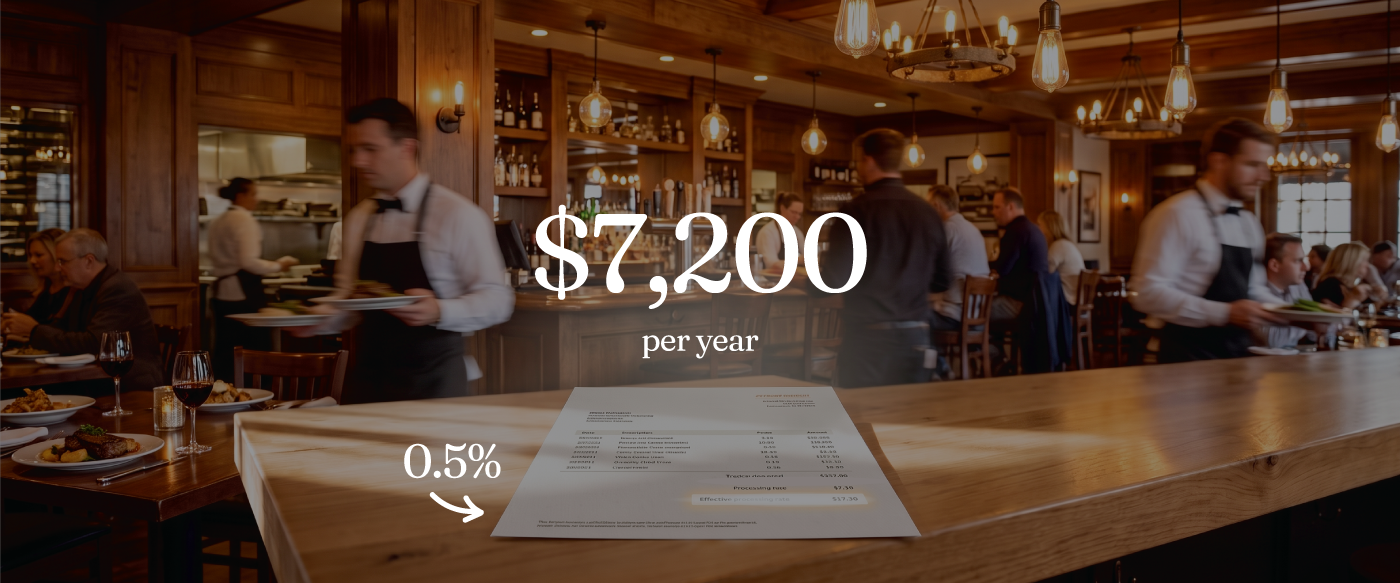
Every half a percent on $120,000 a month is $600. Over a year, that's $7,200. Real money, hiding in a percentage you've probably never calculated.
And for most restaurants, card processing isn't a rounding error. The National Restaurant Association identifies credit card processing as the industry's third-largest operating expense, behind food and labor.
But the rate a processor quotes isn't necessarily the rate you pay. Your total cost can include interchange, card-network fees, the processor's markup, and other account fees. A headline rate might cover only part of that, or blend it all together. So two restaurants with the same quoted rate can end up paying very different effective rates, depending on their card mix and fee structure. That's the reason to compare the actual fees on your statement, not just the headline rate in the sales pitch.
You don't need a consultant to find it. You need a statement and 60 seconds.
Food and labor costs keep climbing. Since 2020, wholesale food prices are up about 35% and restaurant wages up 41%, according to the National Restaurant Association. Most owners are flying blind on the one thing that would tell them where to push back: margin per item. Which dishes actually make you money, and which are you guessing on?
Here the math compounds fast: one point of margin is worth about $10,000 a year at a $1 million location.
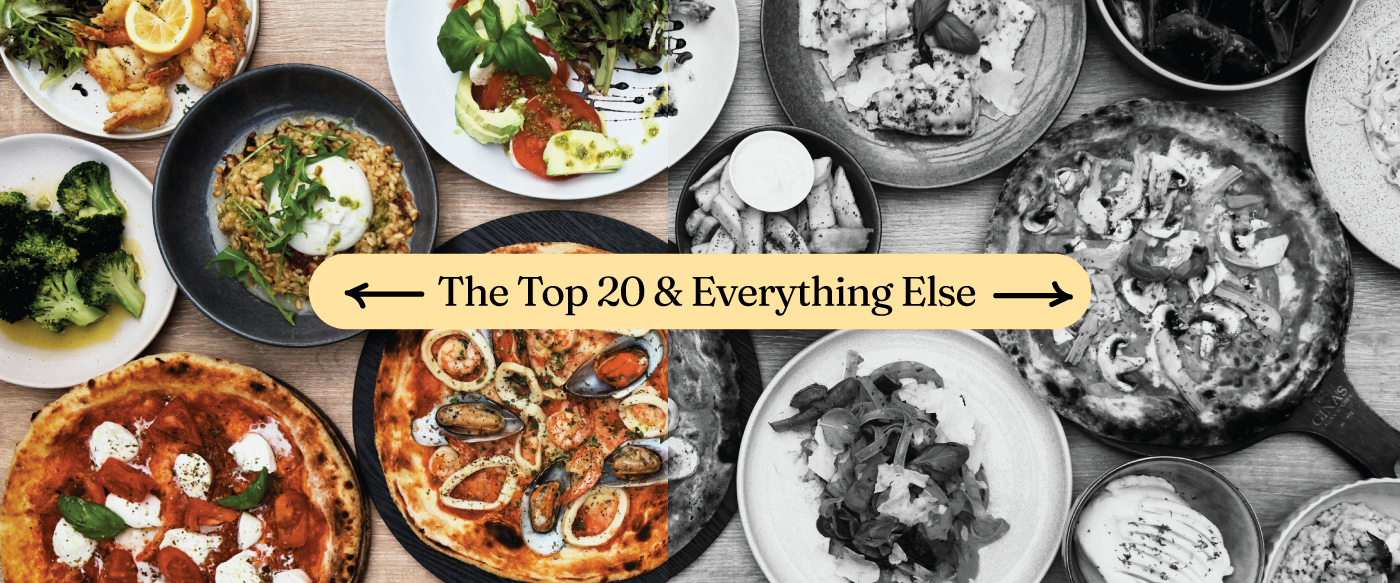
But you don't need to cost out the whole menu to see where the problem is. Start with your top 20 items, the dishes that drive most of your sales. That's usually enough to expose the pattern: a few popular items that look like winners but barely make money, alongside the workhorses quietly carrying your margin.
Once you know which items are carrying the menu (and which are dragging it down), you can make better-informed calls on pricing, portions, ingredients, and what you steer guests toward.
It takes a few hours to do properly, then a little upkeep as your costs change. You don't need a complicated system to start. Take the 20 dishes your customers order most; the answers are probably right there.
Traffic has been soft across the industry for more than a year. Through the first half of 2026, restaurant operators reported net declines in customer visits in 15 of 16 months, according to the National Restaurant Association. Sales have held up mostly because checks went up, often from inflation and price increases, not because more people walked in. And here the core problem bites hardest. The data exists, but almost nothing surfaces it, least of all your repeat rate. It may be the most important of the three numbers, and the one you're least likely to ever see.
Bloom Intelligence, analyzing more than 1,000 restaurants, found a regular guest is worth about $685 over their lifetime, against $26 for someone who comes once. Same table, 26 times the value. A first-timer who never returns isn't the $26 you already rang up. It's the $659 you never will.
Traffic and pricing both have a ceiling. How often a guest comes back doesn't, and it compounds. A regular brings a friend who becomes another regular, who brings two more. Repeat visits are the most powerful growth lever you have.
When read separately, the three numbers are separate problems. Together, they're one larger one that no generic report will show you.
Take a busy best-seller: the dish regulars order without looking at the menu, or the one that's all over TikTok bringing diners in. If its true food cost is higher than you thought, you're making less on every sale. If you're also paying more than you need to in card processing, you're giving up another slice of every ticket. And if too many of the people buying it are first-time guests who never return, you're constantly replacing customers instead of building a base of regulars.
None of those numbers looks catastrophic on its own. Together, they can change the economics of the restaurant.
That's why these shouldn't live in separate reports. Menu margin, payment costs, and repeat visits stack on top of each other, on every ticket. Look at them together and you can see where the money's leaking, and which problem to fix first.
These numbers aren't hard to find, and nobody's hiding them from you on purpose. For most owners, "take a look at these" just sits somewhere on a long list. But in this business there's always a more pressing fire.
Not looking has a price tag, though. The half point you overpay compounds every month, the underpriced dish loses money on every ticket, and the first-timer who didn't come back is gone whether or not you ever counted them. The good news is the reverse is just as true. Each number has one small first step: a statement read, a top-20 costing, a repeat-rate check. Each pays back far more than the time it takes.
There's no grand conspiracy keeping these numbers from you. It's usually just bloated tech stacks and different vendors. Your payments, your POS, and your guest data often live in three different systems, built by three different companies, taped together with integrations that work sometimes. So the three numbers that would actually run your business sit in three places, and you rarely get the full picture.
What are the three numbers every restaurant should track?What you pay to accept payments, what you make on each menu item, and how many guests come back. Your POS collects all three; it just rarely puts them on one screen.
What's an effective processing rate, and how do I find mine?It's the total you pay to accept cards, divided by what you processed, not the rate a salesperson quoted. Add up last month's fees, divide by your card volume, and multiply by 100. Most restaurants land between 2% and 3.5%.
Why isn't the rate my processor quoted the same as what I pay?The quote usually covers only part of the picture. Your real cost also includes interchange and other fees, so your statement almost always runs higher than the rate you were sold. Judge by the total cost on your statement, not the headline rate.
Do I need new software to see these three numbers, or can I find them myself?Some of it, by hand. Your effective rate is on your statement, and item margins you can build in a spreadsheet. Repeat rate is the hardest to pull yourself. The framework isn't about buying anything; it's about knowing to look.
What makes Upserve different from other restaurant POS systems?Upserve started as a data company and added a POS, not the reverse. So payments, sales, and guest data live in one place instead of three, which is what puts all three numbers on one screen. Honesty is the point: some of this you can do yourself.
No sales pitch, no emailed report. Book a quick walkthrough call, bring last month's statement, and we'll find your number together, live. While we're there, we can show you what your margins and repeat rate look like on one screen too.