
.png)
Your lowest-food-cost item might still be your least profitable dish on the menu. That's not a trick question — it's what happens when you manage a menu by percentage instead of dollars.
Take your fries. On paper, they're one of the tightest items you sell: about a 30% food cost, the kind of number that gets a nod on a food-cost report. Now take your ribeye — about 38% food cost, the kind of number that makes an owner nervous. Percentage says the fries are doing you a favor and the ribeye is bleeding you dry. But price the fries at $7 against a $2 plate cost and you bank $5. Price the ribeye at $40 against a $15 plate cost and you bank $25. The dish with the "worse" percentage puts five times the money in the drawer, every time someone orders it.
Food cost percentage feels like the number that matters. It's the one most owners were taught to watch, and the one most POS reports lead with. But percentage doesn't pay your rent — dollars do.
What you bank from a dish is its contribution margin — the dollars left over after plate cost, not the percentage those dollars represent. That's the fries-versus-ribeye gap above, and it's not a contrarian take: it's the foundational premise behind menu engineering as it's taught in hospitality programs, the same principle covered in ServSafe's own materials on the subject.
Neither dish is "wrong" to have on the menu — an entrée and a side aren't a fair apples-to-apples comparison. The point is that food-cost percentage alone can't rank them against each other. A lot of owners are pricing and prioritizing off the wrong number.
Costing an entire menu, ingredient by ingredient, sounds like a week of spreadsheet work — because for a lot of menus, it is. You don't need to do that. Cost the roughly 20% of dishes that drive most of your sales first, a prioritization rule of thumb borrowed from the Pareto principle, not a measured stat — the exact split varies by concept, but your top sellers usually expose the whole pattern fast: the quiet workhorses genuinely carrying your margin, and the crowd-pleasers that sell constantly while barely clearing a profit.
The method itself is simpler than the spreadsheet reputation suggests: add up what every ingredient on a plate truly costs you, then subtract that from the menu price. Take the fries. Potatoes, oil, seasoning, and the container they go out in add up to $2. Subtract that from the $7 price and you're left with $5 in contribution margin — about a 30% food cost. That $5 is the number that matters. The 30% is just how you got there.
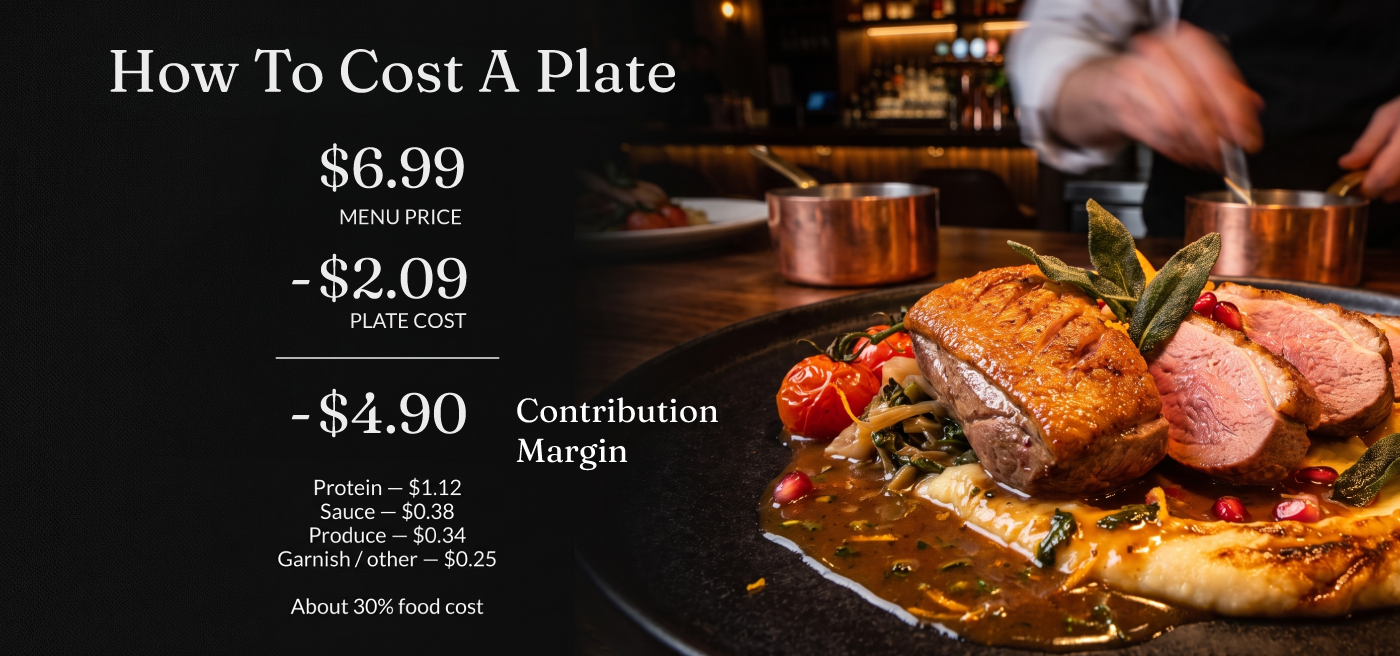
Do this for your top 20 sellers — the fries, the ribeye, and everything else that shows up on your best-seller report — and you'll know more about your menu's real economics than most owners do, in an afternoon instead of a week. If you're already running Upserve, your food cost report is already tracking plate cost and margin per item — you're pulling the number, not calculating it from scratch.
Once you've costed your top sellers, plot two things against each other: how popular each dish is (its share of total sales) against how much contribution margin it earns. The underlying framework — introduced in 1982 by Kasavana and Smith at Michigan State and still taught the same way today — still holds up because it sorts every dish into one of four honest categories. Upserve's own Menu Insights report runs this same shape of analysis today, so this piece uses that naming rather than the academic terms — same four boxes, plain-language labels:
Greatest Hits — high popularity, high margin. Your best dishes, earning their spot on the menu twice over. Protect them; don't mess with what's working.
One Hit Wonders — high popularity, low margin. This is where the fries truly land: they're on nearly every table's order, but at $5 a plate, they're not what's funding your month. Worth a careful reprice — fifty cents barely registers to a guest already ordering fries — or a slightly smaller portion, without losing what made them popular.
Hidden Gems — low popularity, high margin. This is the ribeye's real seat, if it doesn't move the volume the fries do: a dish that earns well but doesn't sell much. Often a positioning problem, not a pricing one — move it up the menu, or have your team start recommending it. It could usually take a dollar more, too, without anyone blinking.
Underperformers — low popularity, low margin. Sells rarely and earns little when it does. The strongest candidate to '86.
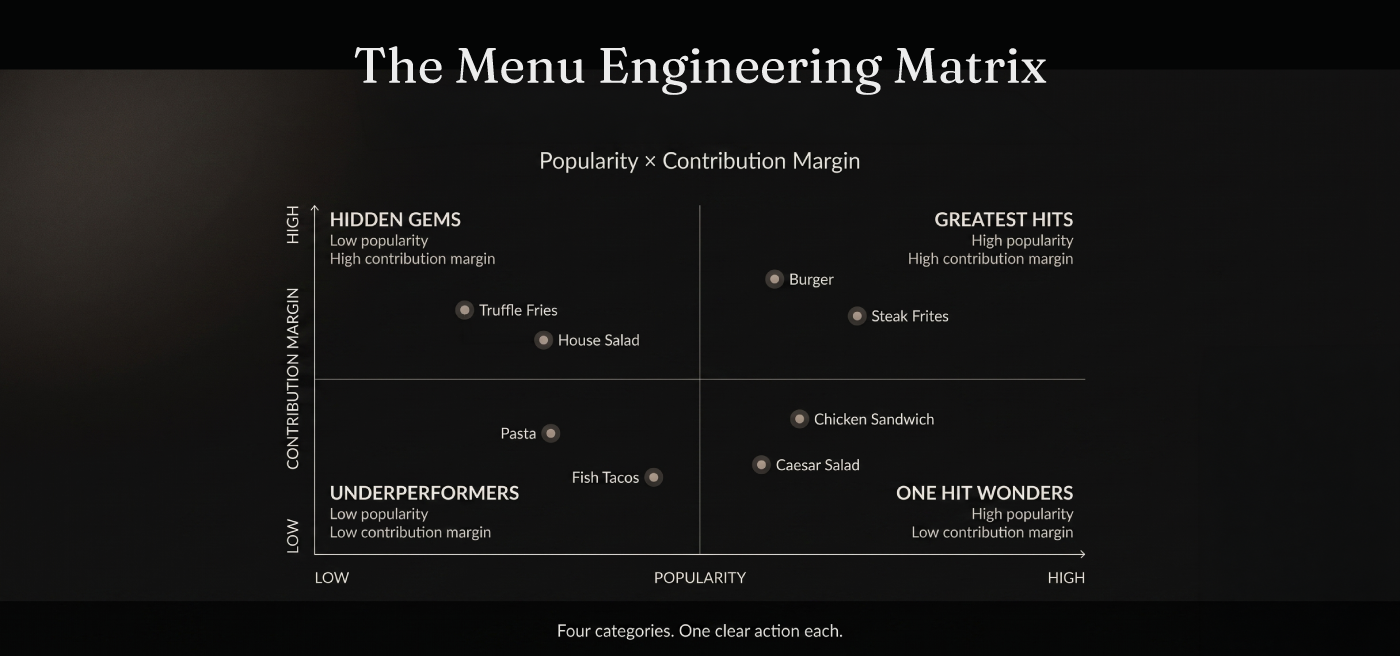
That's the twist the food-cost report never shows you: the safe-looking side that sells itself and the nerve-wracking entrée that quietly pulls its weight can trade places once you look at dollars instead of percentage. Four categories, one clear action each. You don't need software to build this — just your top 20 dishes, their contribution margins, and their share of sales. Upserve's Menu Insights report already runs this same kind of analysis once your recipes are costed, plotting popularity against a second number for every item on your menu. Today that second number is guest return rate, showing you Hidden Gems to promote and One Hit Wonders to rethink. The margin version above is the same four boxes, aimed at a different number.
This isn't automatic or a one-time project. Ingredient prices move — food and labor costs keep climbing, and they haven't gone back down. Per the National Restaurant Association, wholesale food prices are up roughly 35% and restaurant wages up roughly 41% versus 2019, before the pandemic reshaped the cost structure of the industry.
That means a plate cost you calculated six months ago is probably already a little wrong. The upside: the payoff is real and recurring. One point of margin is worth roughly $10,000 a year at a $1M-per-location operation. Claim it once with your top 20 dishes, then plan on revisiting it as ingredient costs shift — a few hours up front, a lighter check-in after that.
What is 80/20 recipe costing? Costing the roughly 20% of menu items that drive most of your sales first, instead of trying to cost an entire menu at once. It's a prioritization approach, not a shortcut that skips the math.
Food cost % vs. contribution margin — what's the difference? Food cost percentage is a ratio; contribution margin is a dollar amount. A dish can have a great percentage and a terrible dollar margin, or the reverse. Dollars are what truly lands in the bank.
How much is one margin point worth? Roughly $10,000 a year at a $1M-per-location restaurant. The exact number scales with your revenue.
What's a good food-cost percentage? Commonly cited at roughly 28% to 35%, though there's no single benchmark that fits every concept — a steakhouse and a pizzeria will land in very different places, and neither is wrong.
How often should I re-cost my menu? Whenever ingredient prices move meaningfully, and at minimum a check-in every few months. A plate cost calculated a year ago is a guess, not a number.
You've got your effective rate. You've got your top 20 dishes costed out. The number most systems still won't show you is who's coming back — and that one's worth just as much.